During my internship at Visit Group I got the opportunity to build a dashboard.
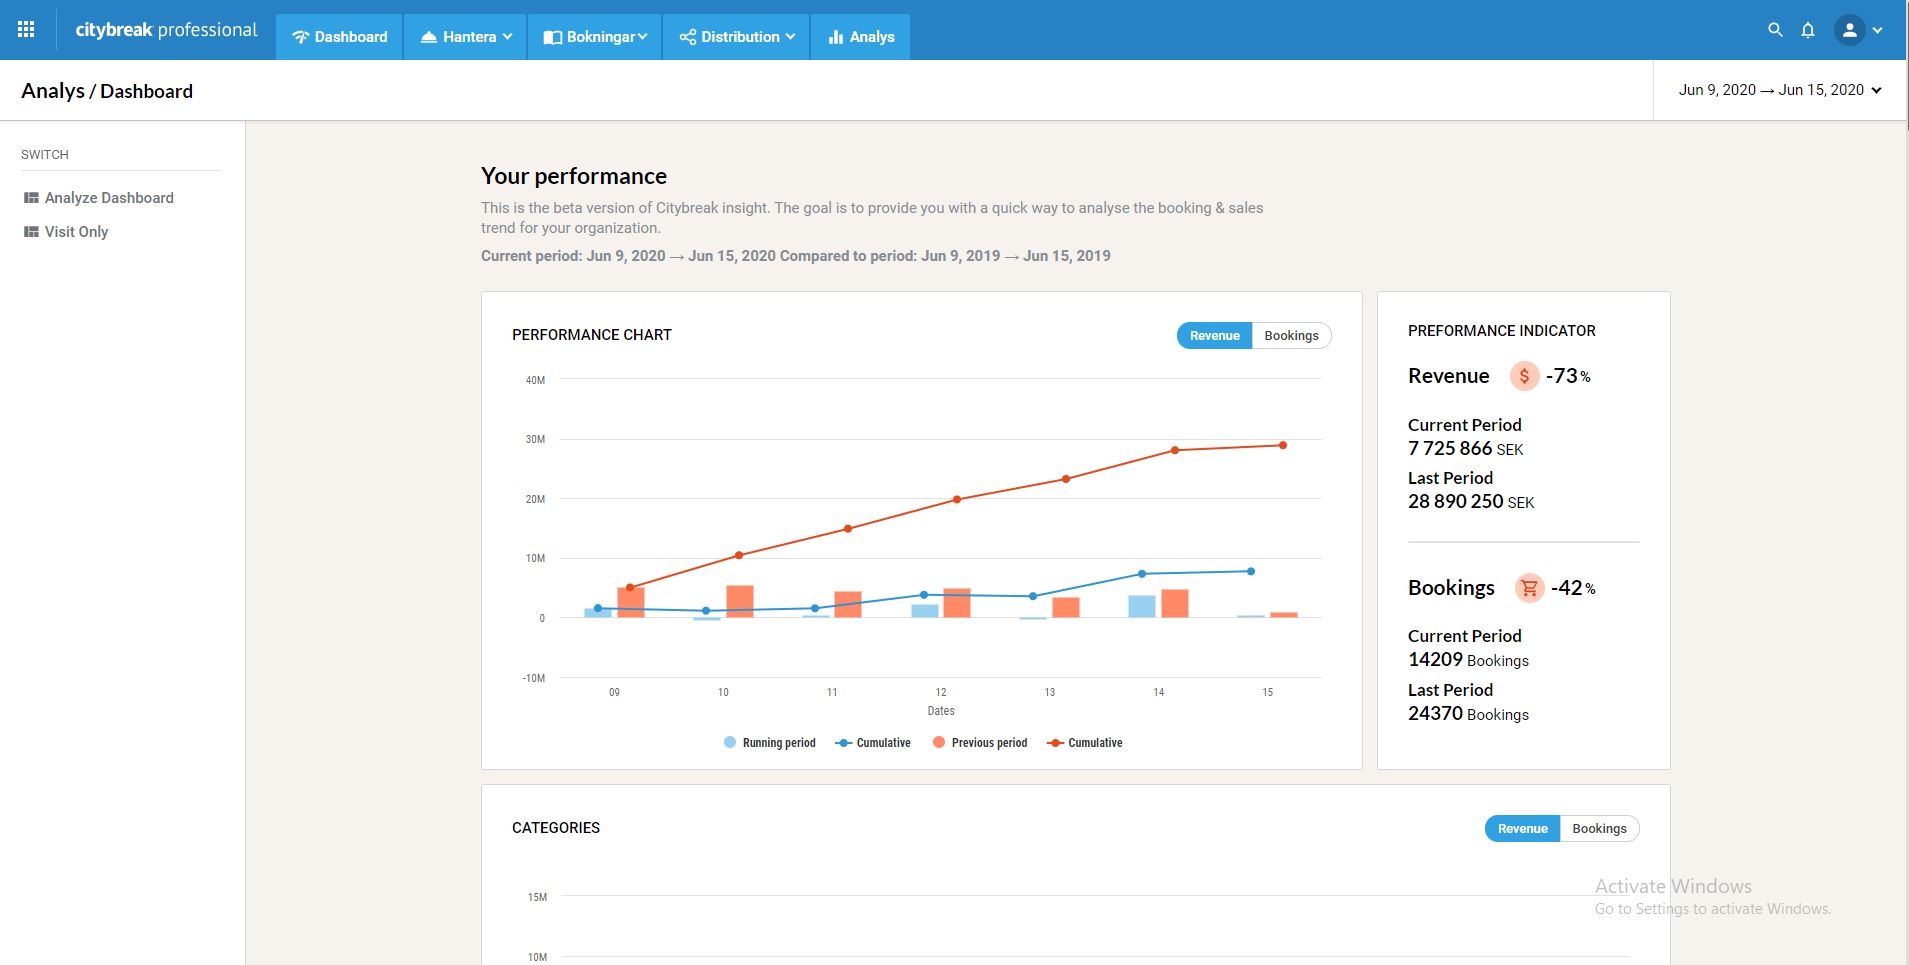
I focused on developing the frontend which consumes data from a document database and displays it through charts and tables. Each chart and table is built as separate modules for the reason of reusing them as widgets on the Visit Group platform.
The dashboard also includes a datepicker where the user can set a desired timespan for the data to be displayed in. Re-rendering the data after given timespan does not require a pageload due to the separation of logic. Instead data is fetched asynchronous and thus rendered individually for each module.
The analyze dashboard went in to production in December 2019 and is being used both by employees and customers of Visit Group.
My time at Visit Group and working on this project has given me good insight in customer based development within an agile workflow.
Reference is available.
Show image
- C# (ASP.NET)
- Vue.JS (Vuex)
- GIT
- HTML
- CSS
- Elasticsearch
- Highcharts

Enlarge image